
How to create a Gantt chart on Excel
What is a Gantt chart?
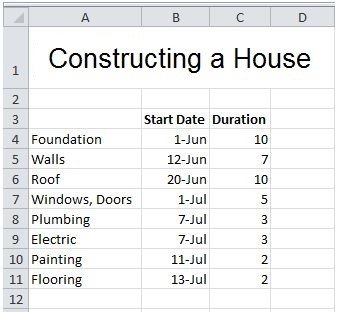
It is a horizontal bar chart which is quite frequently used in the applications pertaining to project management. The chart is eponymous to its founder Henry Gantt. Gantt came up with the idea for this chart in early 20th century. Besides being a mechanical engineer, Gantt was also a management consultant. You can create this chart easily in Microsoft Excel. It appears in the form of several horizontal bars one above the other. It is a perfect way to depict the structural breakdown of the project by displaying the beginning and end dates. It also shows several types of relationships between various activities of the project. It helps the project managers to monitor the progress of the tasks against the deadline or milestones.
Here is how you can create a Gantt Chart in Excel
Although there is no direct way to create the Gantt chart in Excel there is surely a workaround. Excel features the Bar Graph option which can be tweaked and formatted a bit to look exactly like the Gantt chart.
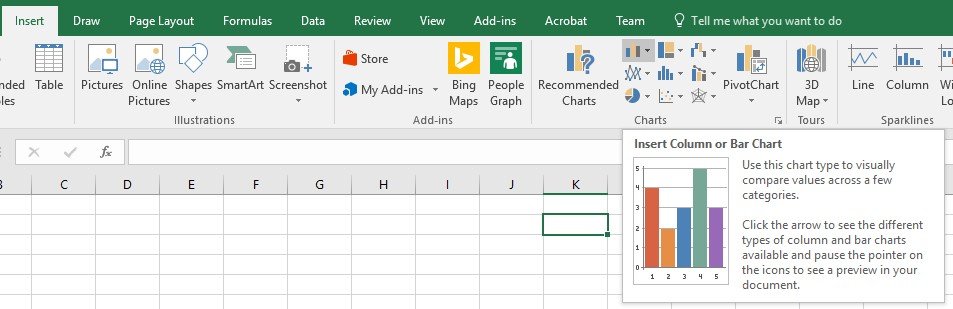
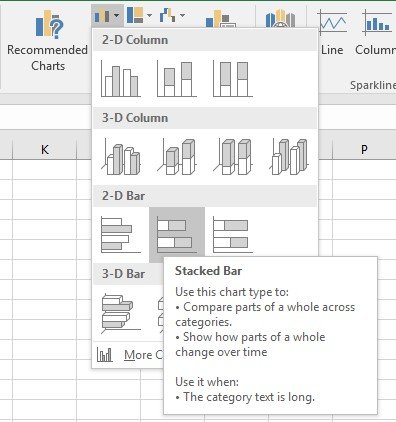
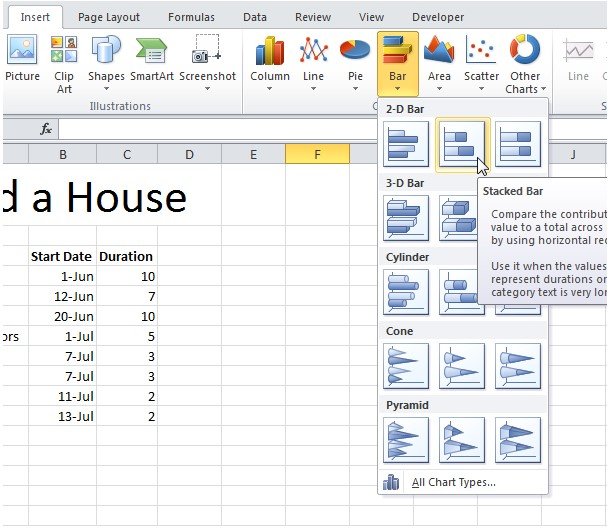
1 – Click on the Insert tab; now click bar and click on the Stacked Bar. On Excel 2016, Stacked Bar might be under Charts menu
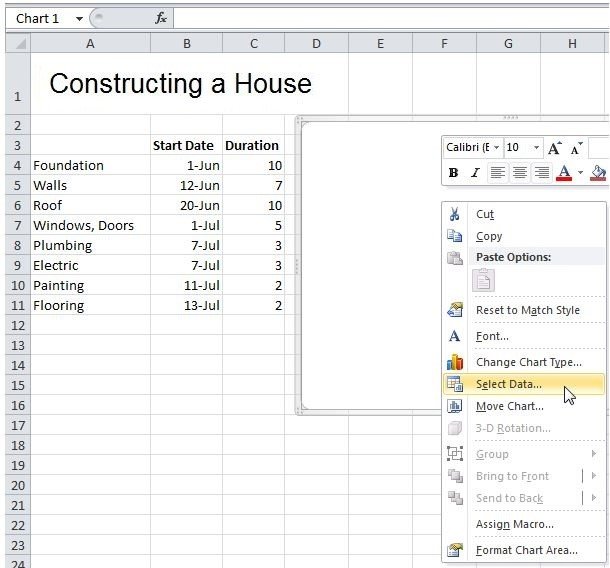
2. Right click over the empty chart and then click on ‘Select Data.’
3 – Now click on Add and then add the two fields (Duration and Start Date).
4 – Under the Horizontal (Category) Axis Labels there is an Edit button; click it. Now select the cells A4:A11.
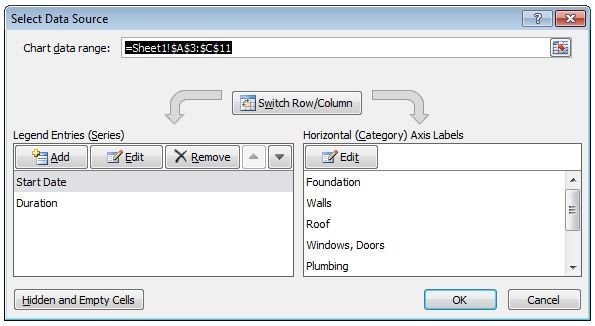
5 – Click OK.
6 – On the right side, click the legend option and then press the key Delete.
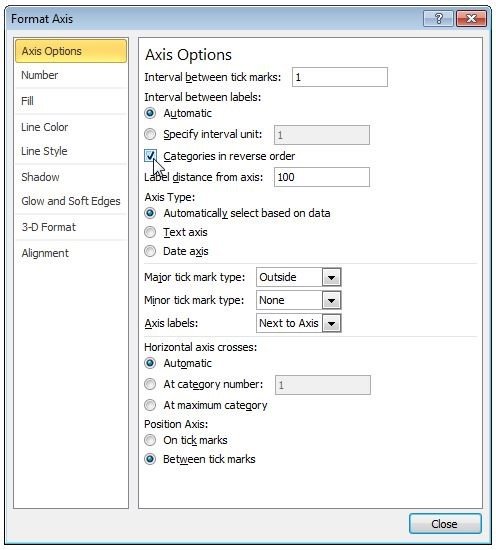
7 – If you need to reverse the order of the tasks (Flooring, Painting etc.) simply right click the tasks directly on the chart and then click ‘Format Axis’. Now simply check the option ‘Categories in reverse order’.
8 – Click Close.
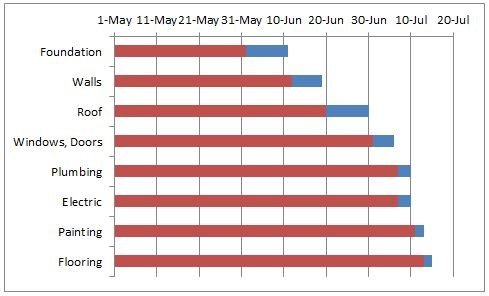
9 – Now you will need to right click on the red bars on the chart. Then click on the ‘Format Data Series; Select Fill and then click the No Fill radio button.
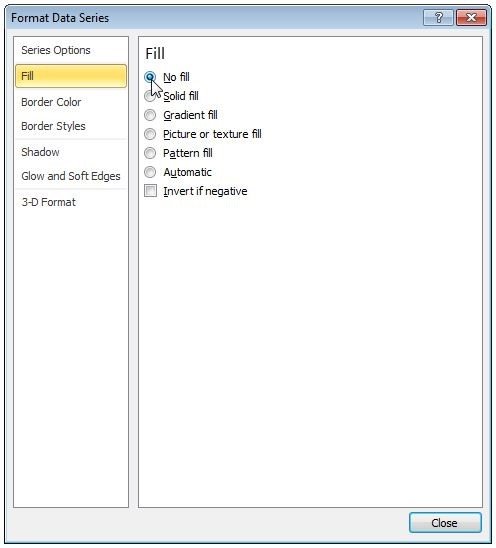
10 – Click Close.
Excel stores the date and time as numbers. Every date is actually the count of total number of days since December 31, 1899 (actually referred to as January 0, 1900). So, 1st June of 2012 becomes 41061.
11 – Open Format Axis again and set the Minimum date to 41061. The maximum will 41103 + the duration of the last task (which is 41103 + 2 or simply 41105). Also set the Major unit to 7.
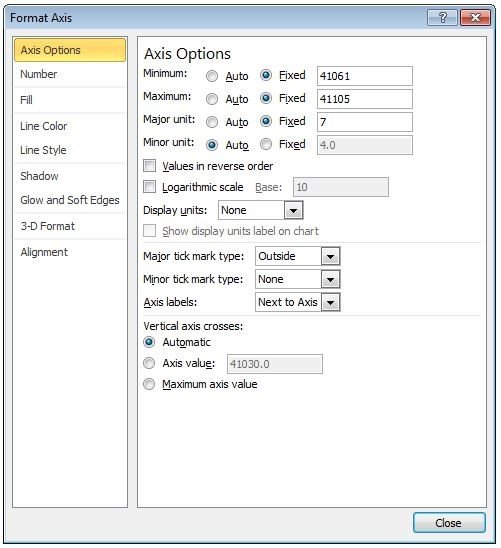
12 – Click Close.
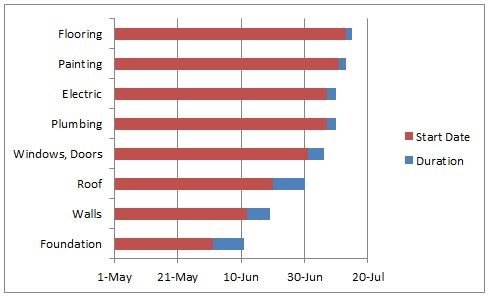
Result. You have a Gantt chart in excel
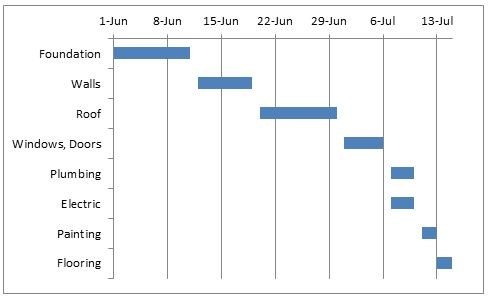
Note that the plumbing and electrical have been executed simultaneously.


